
10 Best Project Management Dashboards for Displaying on Office Screens
What is a project management dashboard? Let’s look at this illustration. Imagine, you’re driving a car, you need to see how fast you’re going, how much gas you have left as well as be aware of any potential problems with your car. A dashboard is how these metrics, controls and instruments are displayed. In other words, a dashboard is a control panel that the driver can see. Project management is the same concept: when working on any initiative, it’s helpful to measure your progress and get a heads up on potential issues.
Project Management Dashboards
So, where a project management dashboard comes into play? While managing projects of any size, using a dashboard can monitor timelines, deadlines, forward motion, and upcoming challenges. In project management, a dashboard is the tool that gathers data. This data is gathered on key performance indicators (KPIs) across various aspects of the project and then displays them in a way that’s easy to reference and understand. These KPIs commonly include performance and progress (across variables like time and cost), workload information, resource allocation, and other critical project metrics.
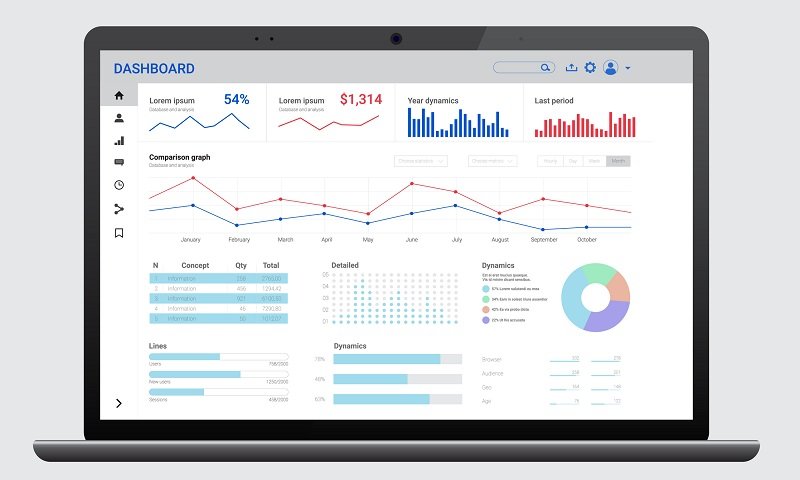
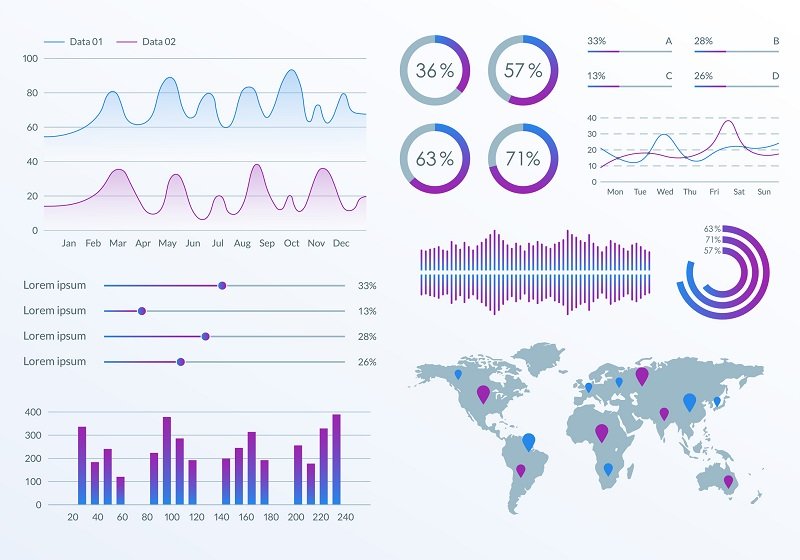
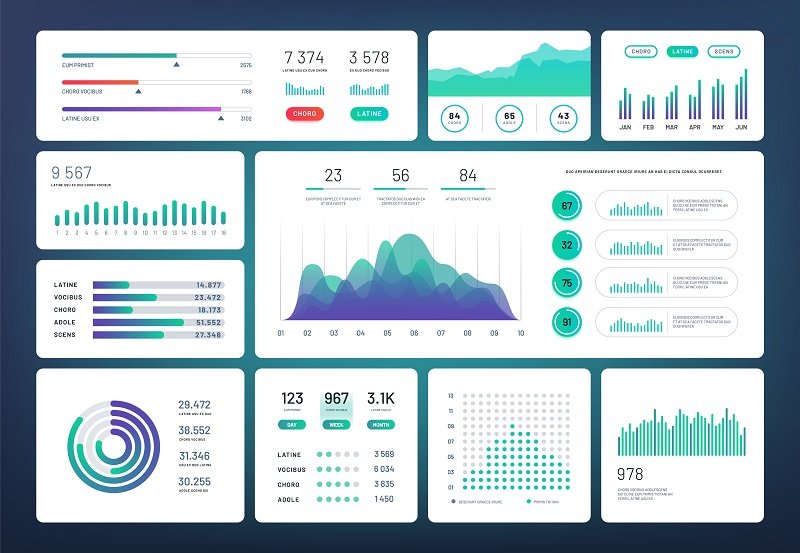
A typical dashboard is a collection of widgets that takes the form of charts or graphs, and updates in real time. Project management dashboards can take several forms, from a custom solution built in-house, to any number of platforms available on the market. Usually, companies will get the most benefit by implementing dashboards that speak directly to the department managing projects, such as marketing, operations, etc.
Dashboards offer one place for team members to see all of their project data laid out. So, there’s a tremendous benefit to installing project management dashboards across digital office screens. Just like with the car example, this information helps organizations drive toward their goals. Ensuring project information is visible and accessible to any people working on the initiative is critical. Furthermore, displaying dashboards in the office setting is a great way to boost employee engagement, which is a critical component of employee productivity and company growth.
Why Display a Project Management Dashboards on your Office’s Screens?
There are 5 main benefits to displaying a project management dashboard:
Visibility
The purpose of a dashboard is visibility. After all, that’s why you create a dashboard and hosting it where more people can see it. A good dashboard will mine, calculate, and display data in a way that lets teams know if their goals are on track.
Saves Resources
Without a dashboard, staff will need to spend time pulling reports. Creating and configuring reports can be time consuming. It also counts as time spent away from the actual tactics of the project. With widgets already created, managers can check on progress whenever they want to without stepping away from something else to generate a report.
All data is in one place
One stored location enable efficient teams. This enables everyone who needs access to have access. Furthermore it drives convenience, as employees don’t have to move from one screen to another, use additional tools, or build their own reports.
Enable data-driven decisions
Any decisions can be backed by actual statistics are always better ones. Giving your entire department access to key numbers will help them make better decisions on a day-to-day basis.
Accountability
Numbers don’t lie. It’s always great to view data that says you’re on track. But in order to see the results you want, you also need to understand where things are falling behind. A dashboard can let the team see at a glance where potential problems lie. Good or bad, staff can see what’s happening with the project and take the necessary steps to improve.
Tips for Sharing a Project Management Dashboards across Office Screens
- Ensure that what you’re sharing is actionable. Enabling employees to viewing numbers that they can’t really impact is frustrating for staff. Ask yourself, what are you trying to communicate? What do you expect employees to do about it? Focus on data that will help teams make better decisions in their day-to-day work.
- Design dashboards that fit your office. You want to make sure that any screens are seamlessly integrated into the physical space. If you’re creating a dashboard in-house, we suggest putting the information that is most frequently looked at in the top left-hand corner. From there, make sure related metrics are grouped together. And that any metrics that need to be compared are next to each other. For an effective dashboard, less is more. If the dashboard is too convoluted, people won’t pay attention to it.
- Display dashboards easily. Having to have team members cast them on screens or change them leaves room for error and takes extra time. Make sure that project management dashboards are easy to see from the minute someone comes into the office space to the time they’re walking out the door.
10 Project Management Dashboards that are Ideal for Office Screens
1. Marketing funnel dashboard
Teams focused on optimizing the customer journey and conversion points, this type of dashboard is helpful. Pull data from your CRM system and marketing automation tools to keep an eye on the number of visitors, leads, and conversion rates. You can also spark more action by keeping this information aligned with company goals or lead quotas.
2. Sales dashboard
This dashboard serves dual purposes. First, it supplies information on important department KPIs. Second, it can remind the team how they’re doing against goals or targets. One easy place to start is by sharing the number of open and closed leads on your dashboard. If you break down goals into a daily, weekly, or monthly number, have the data available so everyone can see how they’re doing. For more context, you can break down different regional areas (if applicable) and provide a comparison to the same time period last year.
3. Customer support dashboard
The overall performance of your support team is important, and they need to regularly see how they’re doing and where there are gaps. Display key metrics like First Response Time and Customer Satisfaction (CSAT) as well as open vs. resolved tickets.
4. Timeline tracking
If your company is working on a big launch, opening, or event, ensure everyone is included and motivated! Display the timeline or countdown on an office dashboard, and share when large milestones are achieved.
5. Software development
There are a number of tools designed to manage software projects. Most of the KPIs and project documents will be more information than your entire team needs to know, but you can share the biggest elements in layman’s terms when possible. Display project progress and key milestones. Show next steps and timeline tracking. It’s also interesting to see the number of tickets or bugs and the number being resolved. You can give your entire office the general idea of what’s happening with your latest website launch without bogging them down with technical details.
6. Quality assurance
For companies that release products, understanding the QA lifecycle is essential. Improving QA measurements by only tiny increments can result in a big difference for large manufacturers. Seeing the various stages of development is interesting, and determining the quality of items going out the door should be important to everyone. Set up your data in a way that helps everyone understand where there can be improvements.
7. Web analytics
If you’re primarily a web-based or ecommerce company, all roads lead back to website performance. It’s crucial that people across departments can understand how their work affects that performance. Set up a dashboard that provides that key information. Whether you have goals around visitors, sales, conversions, social sharing, engagement, etc. Configure the dashboard that answers the most questions for your team, and share the data in real-time.
8. Growth tracking
For newer businesses or those with aggressive growth goals, it’s exciting for all staff to see the numbers. Set up a business analytics dashboard that pulls from multiple sources including CRM, financial software, operational spreadsheets, etc. The goal of this dashboard is to provide real insight based on how all the numbers work together.
9. Profit and loss
Similar to a growth tracking dashboard, this tool provides high-level information on the financials of a firm. Providing a quick view of revenues, costs, and expenses during a given time, these records offer more insight into an organization’s ability (or inability) to generate profits. You could also include data like EBITDA, Profitability Ratios, or any other number of key statistics based on how deep you want to dive. This information tends to be most helpful for people in the financial or operational sector and is less likely to be actionable for individuals in other departments.
10. HR/Employee information
If your company is in the midst of an employee satisfaction initiative, it might be worth boosting morale by sharing some employee statistics. You could include items like overall performance rating, average of overtime hours, recent turnover or new hires, etc. While most of this data will be interesting to only those in HR roles, in some cases it can make sense to share this dashboard more broadly.
Final Project Management Dashboard Inferences
As a recent piece from Harvard Business Review points out, project KPI’s don’t tell the whole story – that’s why they are called “indicators”. There is a whole host of background and information that needs to be properly communicated from the top-down. Your internal communications should help layer in the important context that surrounds what’s present on your dashboard.
The bottom line is that engaged employees are better employees – more productive, more efficient, and more loyal. Sharing various dashboards across your office’s digital screens is just one way to help staff feel more plugged in and more connected. To learn more about tactics that encourage teams to collaborate and cooperate, follow our blog and check out some of the innovative ways business leaders are using digital signage to connect with employees.
We’ll also be creating a follow up piece on specific project management tools. We will share our favorite platforms for collecting and configuring data into dashboards like these. Make sure to subscribe to our email to get access to that article!

